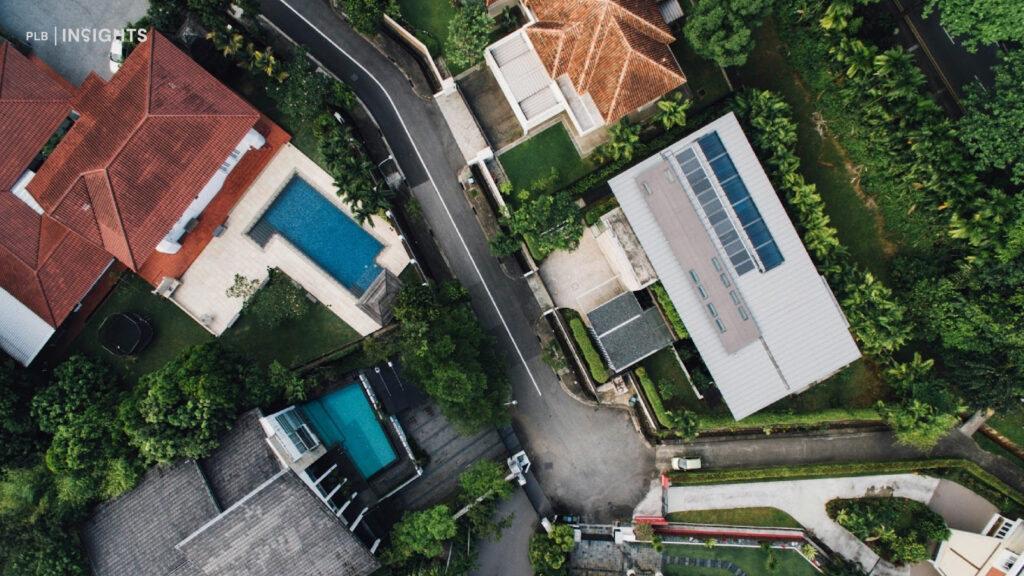
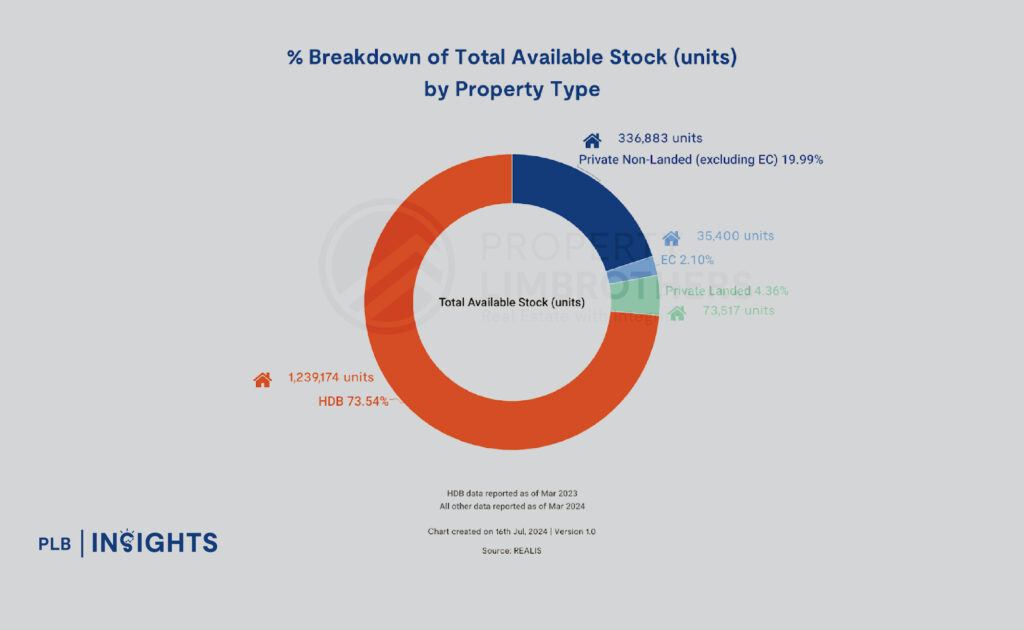
Singapore’s landed properties have long been considered prized treasures, offering exclusive abodes with personal land ownership. These properties are prestigious status symbols and exceptional assets for wealth preservation and growth. In land-scarce Singapore, where every square metre is highly valued, landed properties are rare and valuable commodities. The allure of these properties is further heightened by the scarcity of new landed developments from Government Land Sales (GLS), with the most recent GLS for landed properties occurring in 2017. According to recent statistics, only about 68,400 of the 1,425,100 resident households in Singapore live in landed properties, translating to just 4.8%. This highlights the exclusivity and prestige of owning a landed property in this small island nation.
Landed properties represent a unique asset class, allowing discerning investors the potential to achieve financial gains while investing in an unparalleled exclusive lifestyle. Successful real estate investment requires a deep understanding of market dynamics. The first step is to equip yourself with knowledge of overall market trends. This article explores the key trends and changes shaping Singapore’s landed property market in 2024, providing insights into demand dynamics, supply trends, and price movements.
Increasing Affluence and Scarcity of Landed Homes Drive Up Their Value in Singapore
In a macroeconomic context, real estate prices typically rise as a nation’s financial wealth increases, driven by higher demand for homes from wealthier individuals. Despite recent economic challenges like inflation, recession fears, and rising interest rates, Singapore’s household wealth continues to grow, albeit at a slower pace—8% year-on-year in the first quarter of 2024. These dynamics enhance the allure and value of landed properties in Singapore. With the economy progressing steadily and the supply of landed homes decreasing, the value and prices of these properties are expected to continue their upward trajectory.
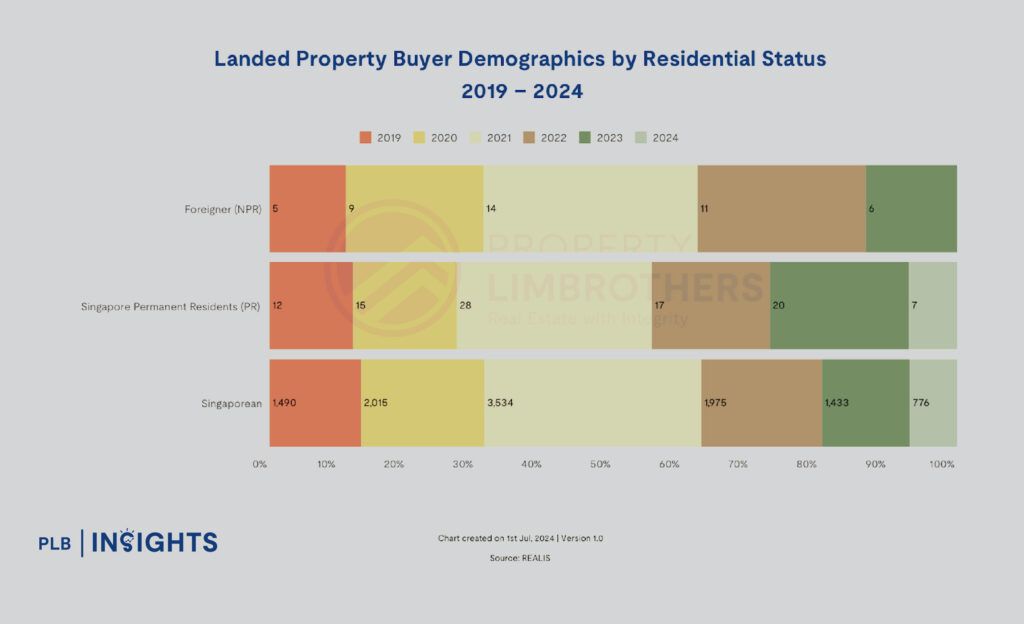
The graph above shows that the overwhelming majority of landed home buyers are Singaporeans, with Permanent Residents and Foreign buyers making up a small fraction. Notably, this cohort of Singaporean buyers includes high-net-worth individuals who have become naturalised citizens. Despite the Additional Buyers’ Stamp Duty (ABSD) increase in April 2023, which imposes an extra 5% for Permanent Residents and a hefty 60% for Foreigners, the demand for landed properties remains strong among Singapore citizens. In 2024, out of 783 recorded sales transactions for landed properties, 99% were purchased by Singapore Citizens and only 1% by Permanent Residents, with no Foreign buyers. This data shows that the ABSD increase has not adversely affected the demand for landed properties, which continue to be a prestigious asset class for wealth preservation and growth.
Landed Property Stock by Type & Region
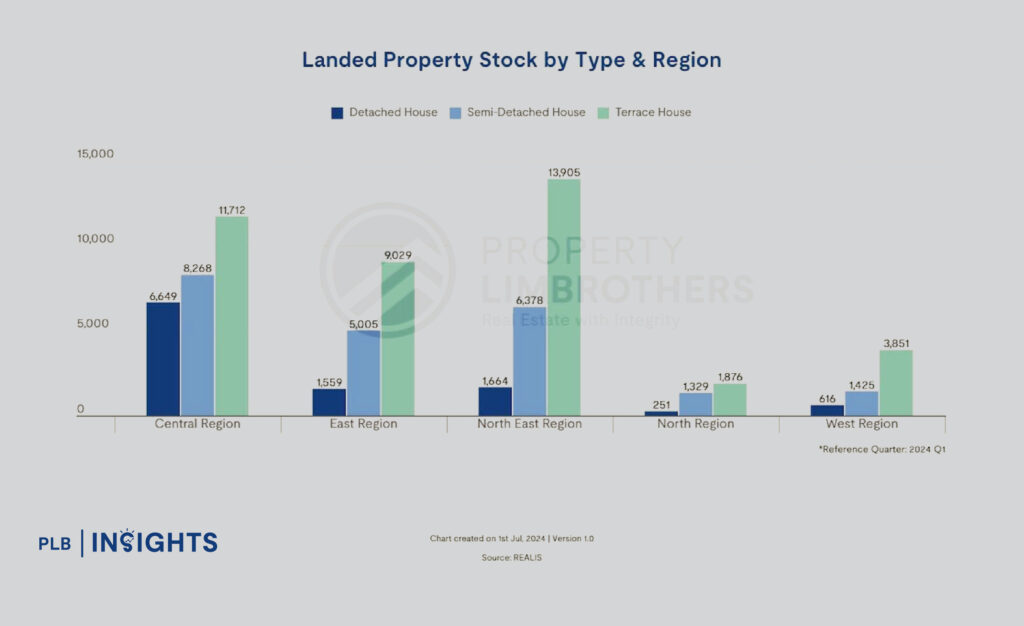
Inter-Terrace homes make up the majority of the landed property supply, totaling 40,373 or 54.9% of the available inventory. Semi-Detached homes follow with 22,405 units, representing 30.5% of the inventory, while Detached homes account for 14.6% with 10,739 units. Notably, the North-East region has the highest number of Inter-Terrace homes at 13,905. For those considering an investment in landed properties, Inter-Terrace homes are an ideal starting point. They offer personal land ownership and significantly larger living spaces compared to HDB flats or condominiums, while maintaining a more affordable overall price.
Analysis of Regional Price Trends for Landed Properties
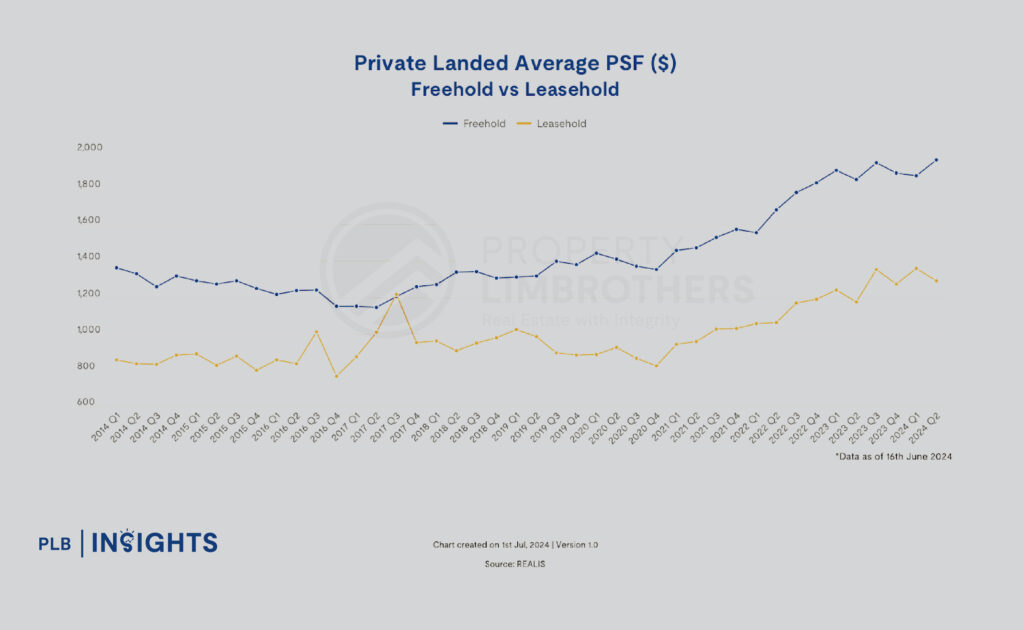
Before examining the regional price trends in Singapore, let’s analyse the price trends of Freehold versus Leasehold properties across all regions over the past five years, from Q2 2019 to Q2 2024. In Q2 2019, the average Per Square Foot (PSF) price for Freehold landed homes was $1,317, rising to $1,955 by Q2 2024, reflecting a 32.63% increase. For Leasehold landed homes, the average PSF price grew by 23.64%, from $985 to $1,290 during the same period. Although the graph shows a more significant growth for Freehold properties, this doesn’t necessarily mean they are better financial investments. Freehold homes typically come with a premium due to their tenure. The data includes various types of landed homes, from Inter-Terraces to Detached bungalows, each with different price trends and behaviours across regions. Additionally, each individual property has unique selling points that command its own price. This graph provides a general benchmark of average transaction prices for Freehold and Leasehold properties.
West Region
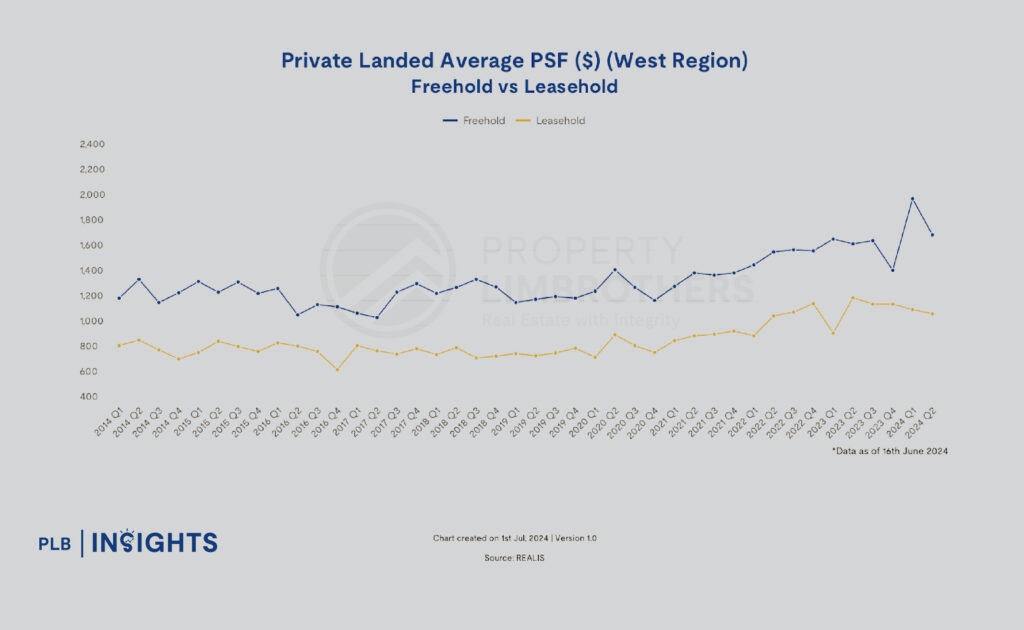
Freehold landed homes in the West region experienced an average PSF price increase of 29.6%, rising from $1,210 in Q2 2019 to $1,718 in Q2 2024. During the same period, Leasehold landed homes in the West grew from $760 PSF to $1,095 PSF, marking a 30.6% increase. This higher growth rate for Leasehold homes in the West highlights how different regions exhibit distinct price trends and behaviours. Additionally, price trends can vary within each region depending on the type of landed property.
North-East Region
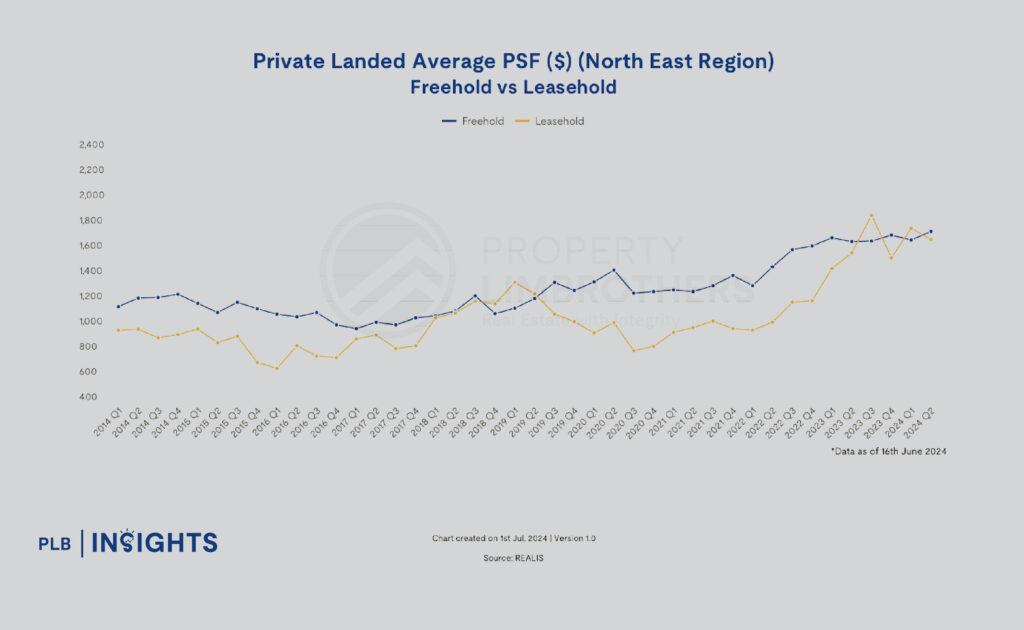
In the North-East region, the average PSF price for Freehold landed homes increased by 30.5%, from $1,217 in Q2 2019 to $1,750 in Q2 2024. Leasehold landed homes grew by 25.6%, from $1,255 to $1,687 in the same period. Interestingly, there were two instances between Q2 2019 and Q2 2024 where the average PSF price of Leasehold landed homes surpassed that of Freehold homes. This challenges the notion that Freehold landed homes always perform better and are the superior investment choice.
North Region
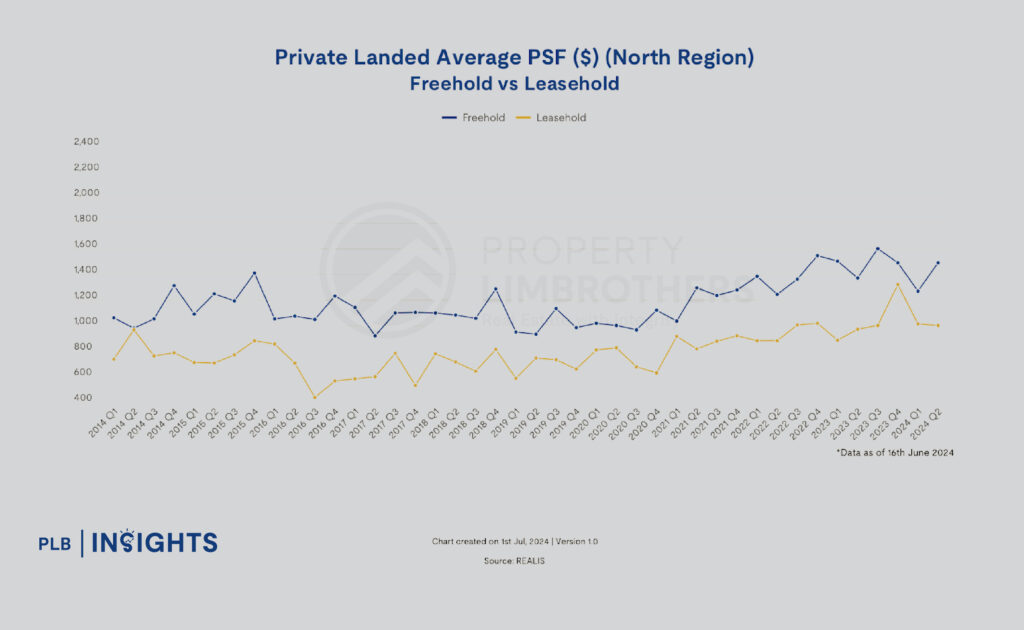
In the North region, Freehold landed homes saw a 37.4% increase in average PSF prices, rising from $932 in Q2 2019 to $1,488 in Q2 2024. Leasehold homes in this region experienced a 25.8% increase, with average PSF prices growing from $743 to $1,002 during the same period.
East Region
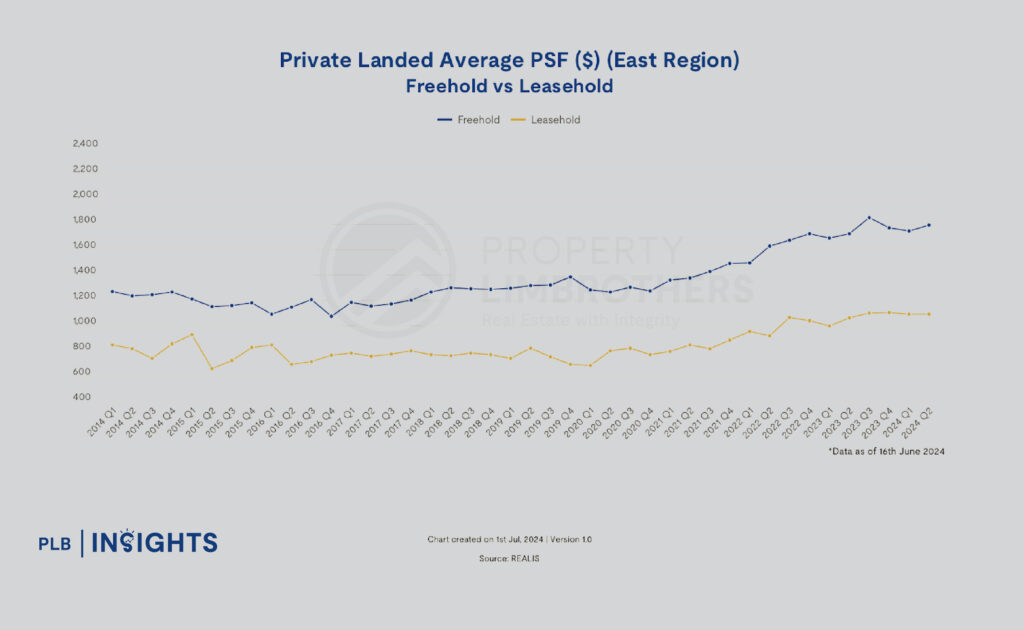
In the desirable East region, Freehold landed properties saw a 26.8% increase in average PSF prices, rising from $1,313 in Q2 2019 to $1,793 in Q2 2024. Leasehold properties in the East grew by 24.7%, from $822 PSF to $1,091 PSF during the same period. Although the price growth is relatively uniform compared to other regions, the East region has the highest average PSF prices. This is attributable to the high demand for landed homes in this sought-after area.
Central Region
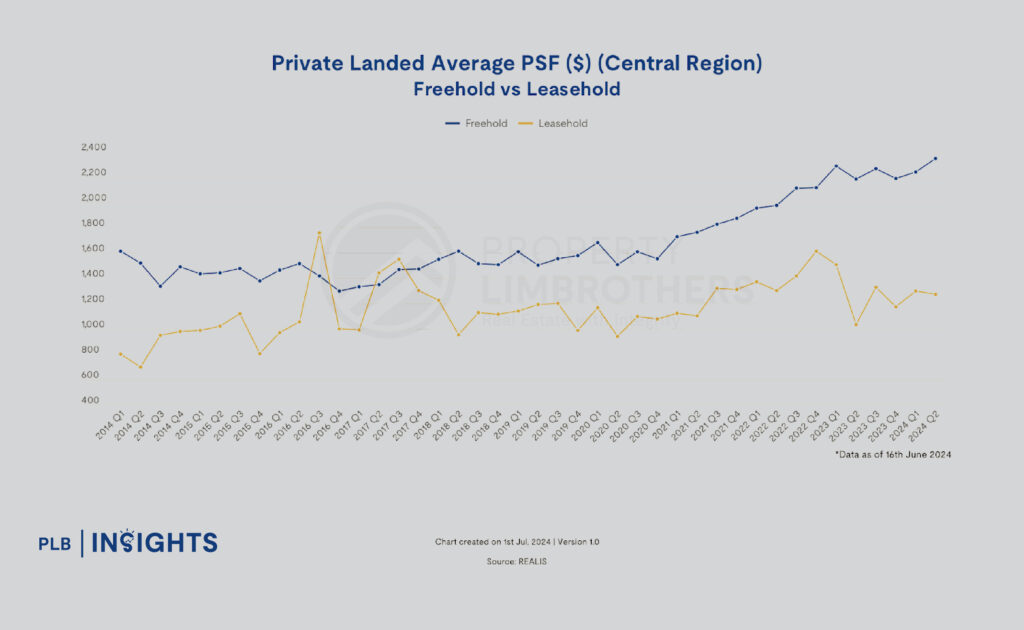
In the Central region, Freehold landed homes saw an average PSF price increase of 35.9%, rising from $1,503 in Q2 2019 to $2,346 in Q2 2024. During the same period, the average PSF price for Leasehold landed homes grew by 6.4%, from $1,192 to $1,273. Although the overall increase for Leasehold homes was modest, their prices experienced sharp fluctuations, spiking to $1,611 in Q4 2022 and dropping to $1,033 in Q2 2023 before gradually rising to the latest benchmark. These volatile price trends for Leasehold homes are attributable to the abundant availability of Freehold options in the Central region and the recent ABSD increase that priced out Foreign buyers, prompting discerning Singaporean homebuyers to favour Freehold properties for their potential for long-term capital appreciation.
Regional Price Trend Analysis and Insights
Analysing the price trends of Freehold and Leasehold landed homes across the different regions, there are a couple of takeaways that you can use as rough guidelines into choosing your dream landed home.
Robust Prices of Landed Homes Despite Latest ABSD:
The strong growth in transacted PSF prices of landed homes across all regions indicates that the exclusive landed property market remains resilient to the ABSD increase, continuing to serve as a safe haven for financial investment.
Freehold Homes Are Not Always the Better Investment Choice:
In the North-East region, there have been three instances between Q2 2019 and Q2 2024 where the average PSF price of Leasehold landed homes exceeded that of Freehold homes. Additionally, in the West region, the average PSF price growth for Leasehold landed homes was higher than that of Freehold homes, with increases of 30.6% and 29.6%, respectively. The key takeaway is to focus on the unique features of the specific property you are considering. It is also crucial to account for the remaining lease duration and to have a sound exit strategy that aligns with your property choice.
More Affordable Options in the North Region:
For those starting their journey in the landed property market, the North region offers a prudent choice due to its more affordable PSF pricing. This helps keep the overall quantum price at a more manageable level.
Higher PSF Price Does Not Guarantee a Better Investment:
In the North region, despite having the lowest average PSF price for Freehold landed homes compared to other regions, the growth rate from Q2 2019 to Q2 2024 was the highest. Similarly, Leasehold landed homes in the North region experienced a higher growth rate than those in the sought-after East and North-East regions, even with the lowest average PSF price. This highlights that a lower PSF price can still lead to significant investment growth.
Other Considerations To Take Note Of
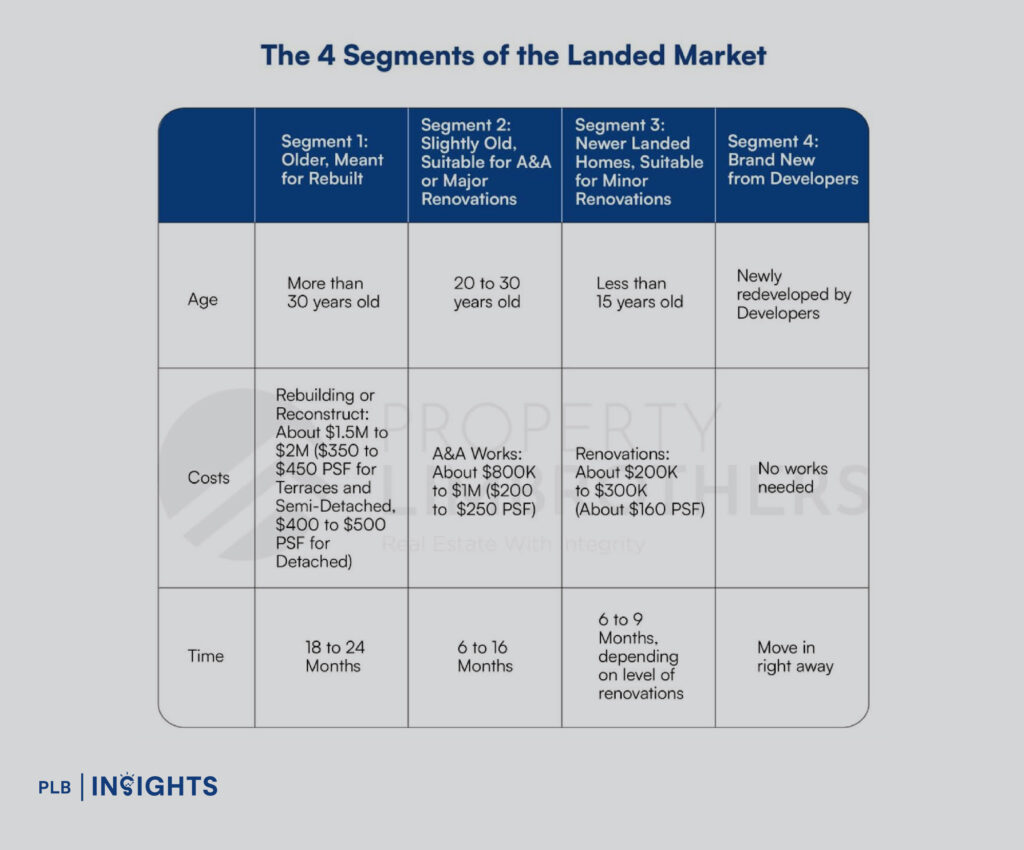
Beyond understanding the overall price trends for the type of landed property and its region, it’s crucial to consider renovation costs. When driving through landed enclaves, you’ll often see older or even dilapidated homes alongside luxurious, contemporary ones. To simplify your understanding, we’ve categorised landed homes based on their age, along with estimated renovation or rebuilding costs and timelines for completion. For a deeper understanding of these different segments and their implications, click here to read our detailed article on the topic.
Segment 1 Homes: More Than 30 Years Old
Homes in this segment are the oldest and would typically require rebuilding or reconstructing, and consequently would require the highest costs for such, on top of the purchase price of the home. It is estimated that rebuilding or reconstruction costs could range from $1.5 million to $2 million for Inter-Terrace and Semi-Detached homes, which translates to a cost of $350 to $450 PSF.
Segment 2 Homes: Within 20-30 Years Old
Homes in this category typically require Addition and Alteration (A&A) work or major renovations, with estimated costs ranging from $800K to $1 million, according to builders. This translates to a PSF cost of $200 to $250. The completion time for these A&A or major renovation projects is estimated to be between 6 and 16 months.
Segment 3 Homes: Less Than 15 Years Old
These homes are generally well-maintained and built to their maximum potential floor size, requiring minimal renovation for plumbing, electrical wiring, flooring, and other minor works. Renovation costs are estimated between $200K to $300K, or about $160 PSF. The total cost may vary depending on the extent of the renovations. Typically, renovation work for Segment 3 homes takes around 6 to 9 months to complete.
Segment 4 Homes: New Homes From Developers
Segment 4 homes are brand new and move-in ready, requiring little to no renovation. This saves significantly on renovation costs, although the savings are typically reflected in the higher purchase price. Nevertheless, these new homes offer the convenience of immediate occupancy.
In Summary
The Singapore landed property market continues to demonstrate resilience and growth despite economic challenges and recent policy changes like the ABSD increase. The market’s robustness is evident in the consistent demand and rising PSF prices across all regions, underscoring the enduring allure of landed properties as prestigious assets for wealth preservation and growth.
Key takeaways include:
1. Demand Driven by Local Buyers: Singapore Citizens, including many high-net-worth individuals, dominate the market, indicating strong local demand that mitigates the impact of higher ABSD rates on Permanent Residents and Foreign buyers.
2. Regional Price Trends: Different regions exhibit unique price trends, with significant growth observed in both Freehold and Leasehold properties. For instance, the North region, despite lower average PSF prices, has shown the highest growth rates, making it a viable starting point for new investors.
3. Freehold vs. Leasehold: The assumption that Freehold properties always provide better investment returns is challenged by instances where Leasehold properties have outperformed in certain regions. Therefore, focusing on the unique features of each property, considering the remaining lease duration, and having a sound exit strategy are crucial.
4. Renovation Costs: Understanding renovation costs is essential. Homes can range from needing extensive rebuilding to being move-in ready, impacting overall investment costs and timelines.
By staying informed about these trends and considerations, potential investors can make more strategic decisions in the dynamic Singapore landed property market. For more detailed insights, join our Landed VIP Club and stay updated with the latest market trends and expert advice.

