If 2020 was the year of new launches, then 2022 is the year of resale properties. In a previous article, we mentioned how new launch and resale prices are fundamentally linked to each other, and this is a trend that is coming in full force in 2022.
In this article, we go into detail about the forces behind the upcoming wave of focus on resale properties, and how one can benefit from this seasonal trend, whether you are looking to sell or buy a home.
Real estate is cyclical – new launch prices pushing buyers to resale instead
New launches and resales are viewed as competing products in the same way that brand new and second-hand goods are compared. Buyers are looking for the best deal for their money and the price of these new and resale units are always reacting to one another. Since all new launches turn into a resale product the moment they are purchased, the price of a new launch sets the highest benchmark for the price of a resale, all else being equal. Hence, new launch prices are said to lead resale prices.
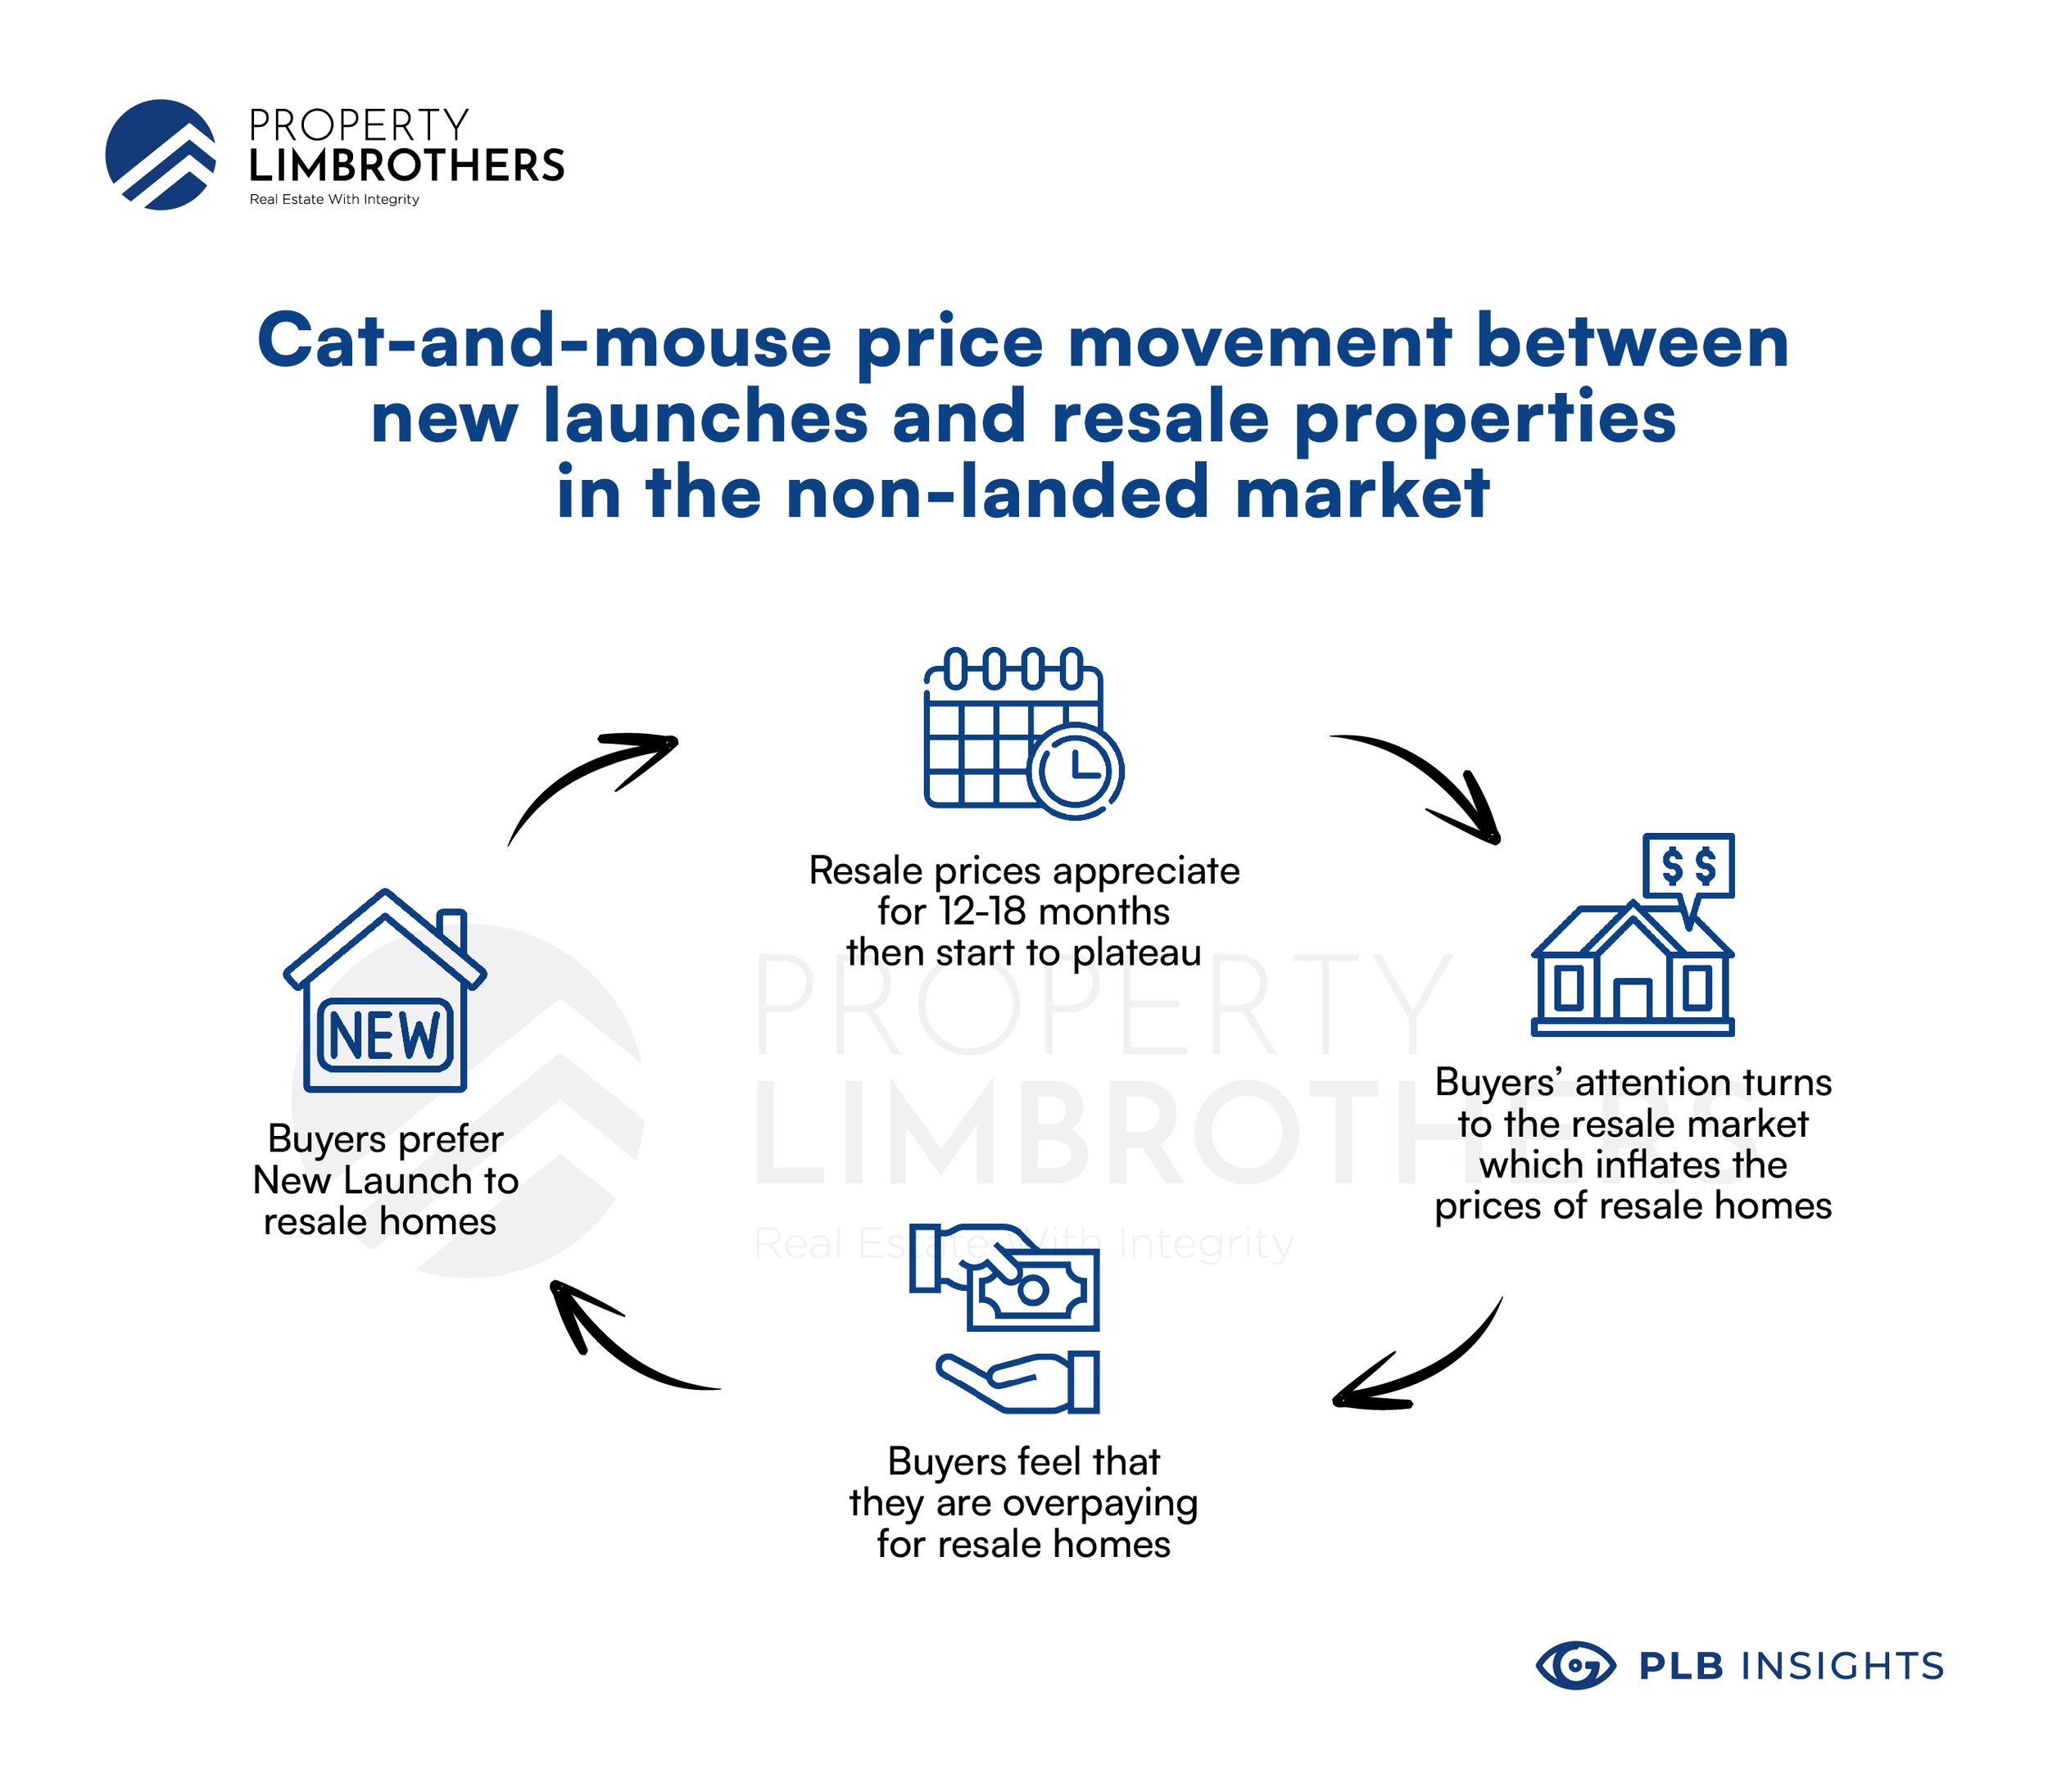
This observation is fundamentally a disparity effect, whereby buyers who want new launches are priced out of the segment and look towards the next best alternative that is resale units.
We see this reflected in the historical data for these two segments. From 2015 to 2017, new launch prices stayed flat at $1,200 PSF while resale prices rose past $1,200. From 2017 to 2019, demand then shifted back to new launches driving price up to $1,800. From 2019 to 2021, buyers found new launches too expensive and moved back to resale, causing a sharp increase to $1,400.
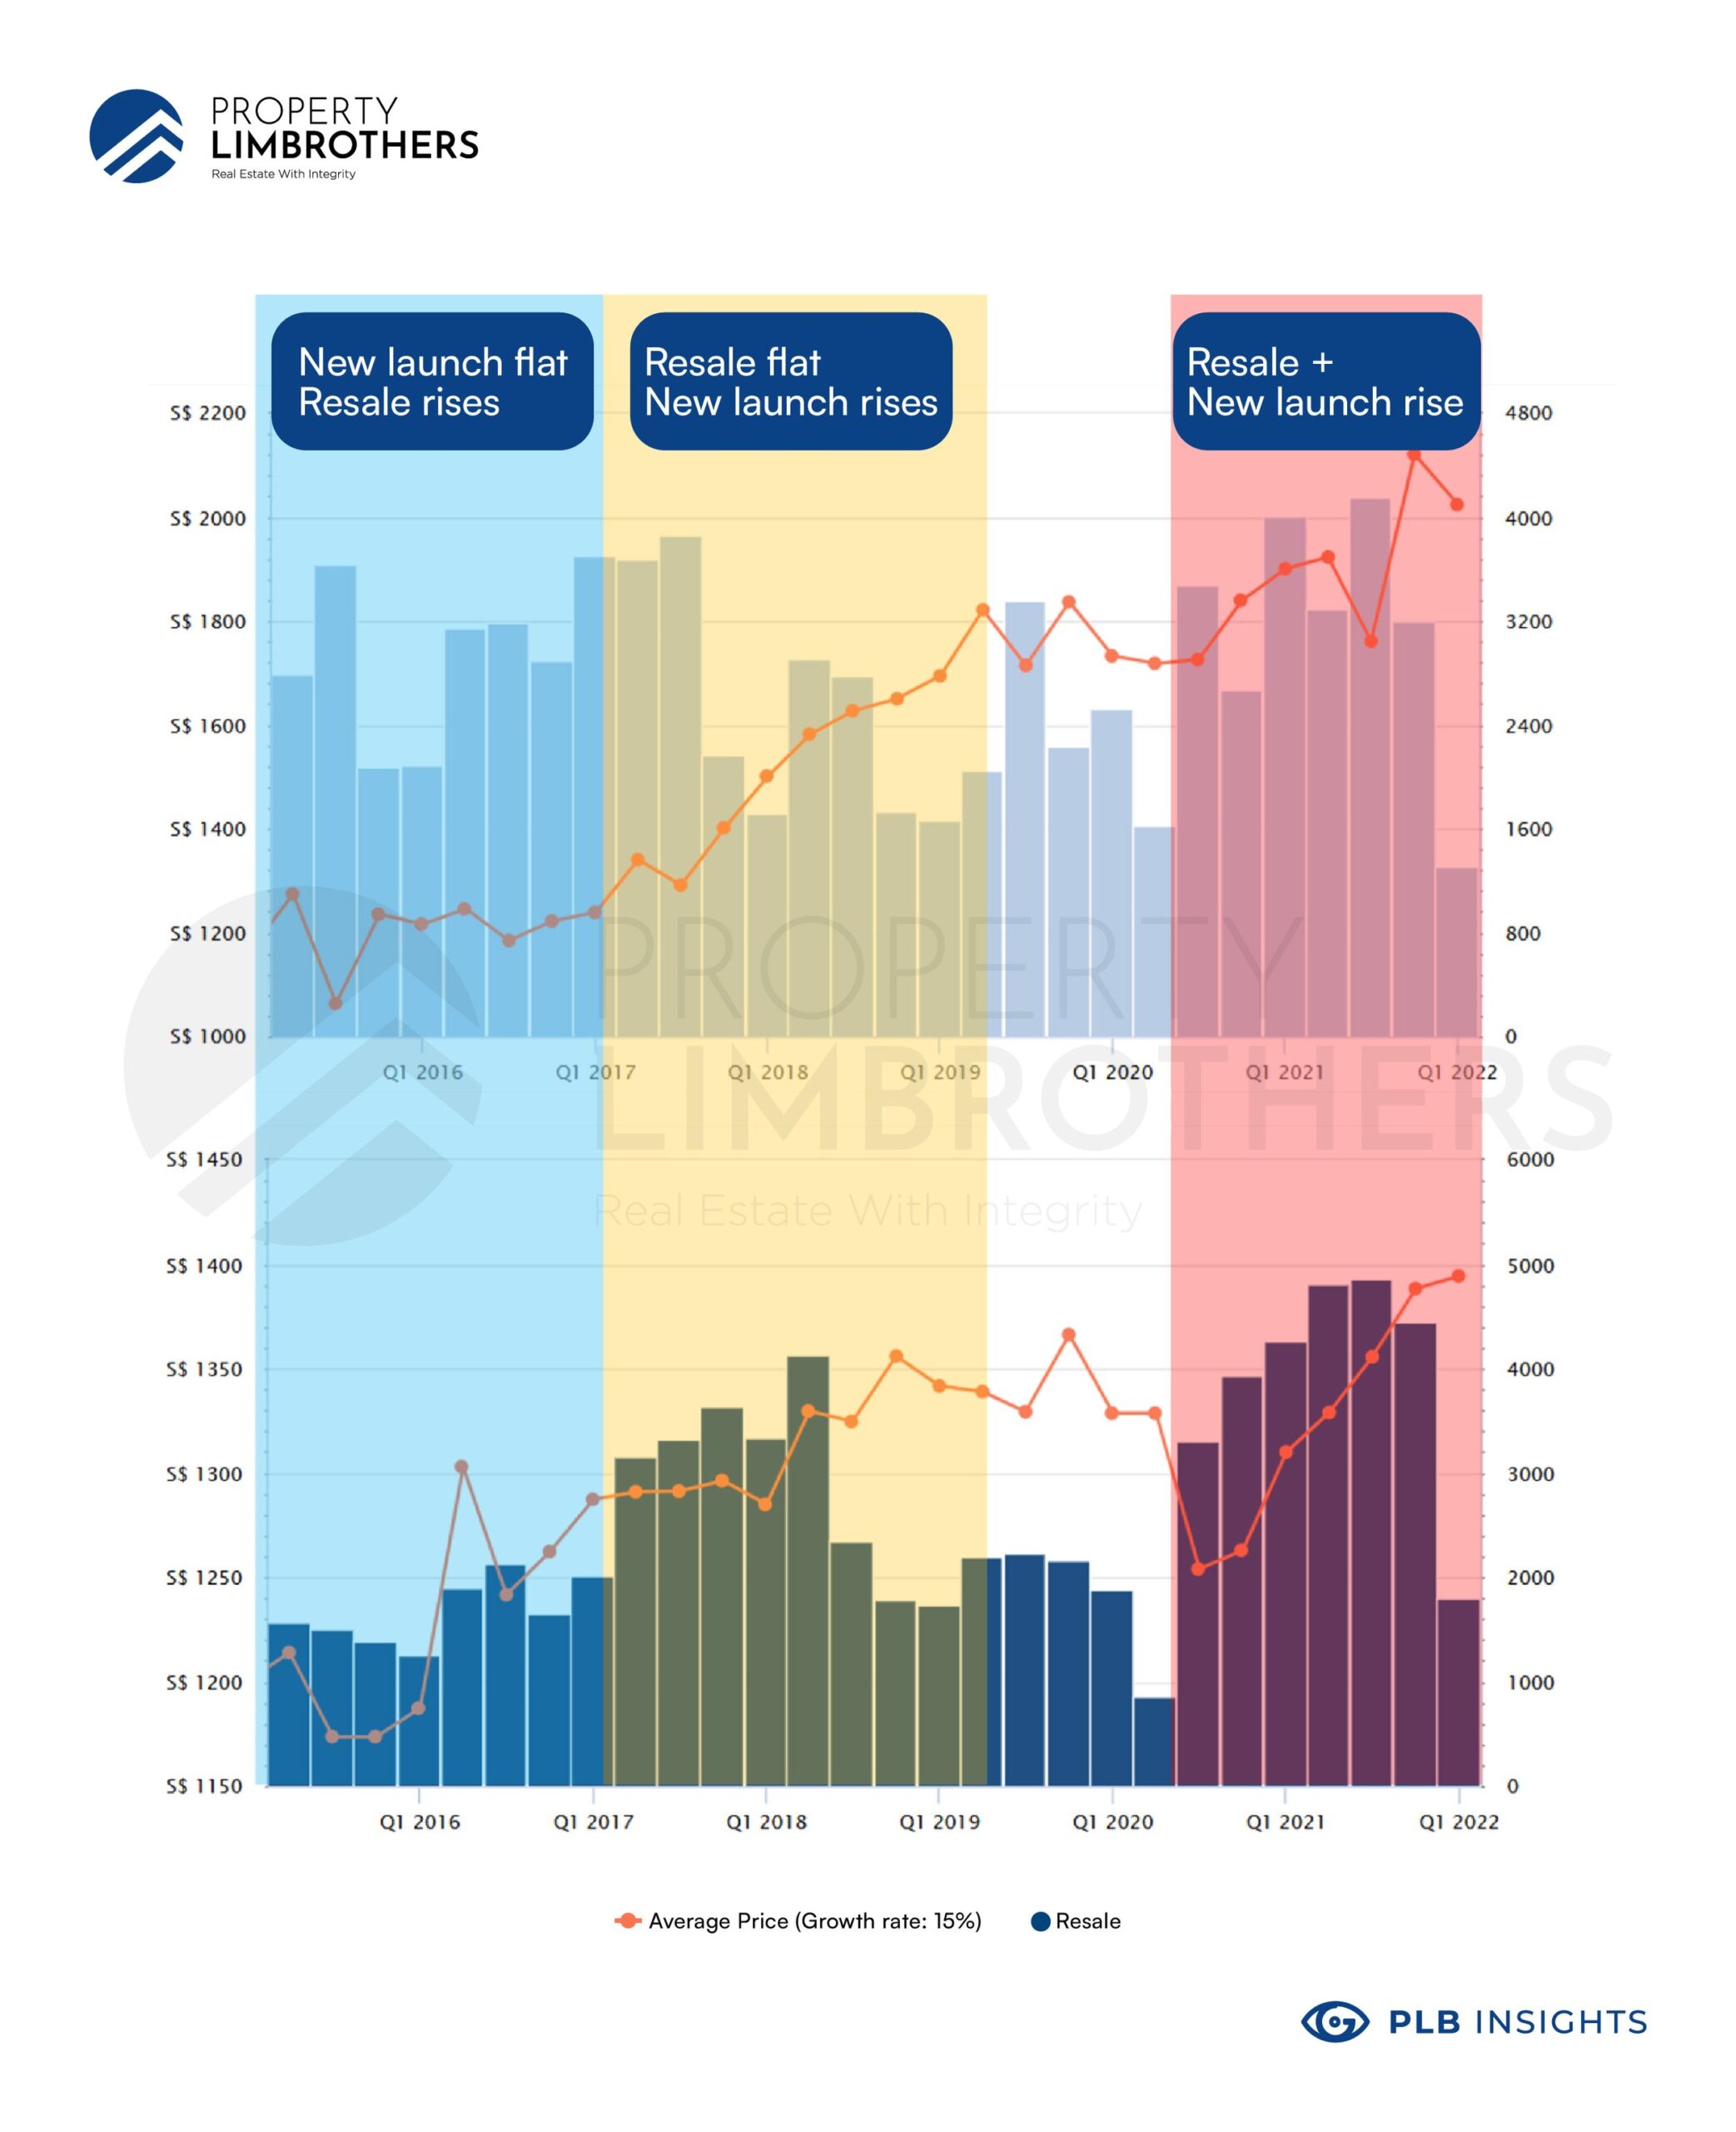
PSF prices of new launch and resale prices from 2015 to present
Understanding why this cycle happens – developers alternate between land acquisition and building
The price trends of new launch and resale are driven by project developers alternating between periods of land acquisition and construction. Like any business, a real estate developer has to convert their inventory, in this case land area, into a product – the brand new residence – that is then sold to the public for profit.
The case of Slim Barracks illustrates this point. Developers purchased the plot of land at a PSF per plot ratio (PPR) of $1,200 as set by URA. The additional costs for construction, marketing, and profits were added and the units were priced at $2,100 – $2,200 PSF to public. Once the project was completed, initial buyers then set their asking price at $2,200 – $2,400 to make a profit. If the price of these units did not reach their asking price, they had the option of holding the unit or renting it out for passive income to supplement their mortgage payments and maintain their property holding. When the units are sold at $2,400 PSF, surrounding projects that are lower in price will steadily appreciate towards this $2,400 PSF as a benchmark.
As developers focus on constructing new projects, they deplete their land bank and have to focus on acquiring more land either through bidding for government land sales or en-bloc purchases. The focus on construction or land acquisition typically alternate every 2 years and this is reflected in the peaks and troughs seen in the supply chart.
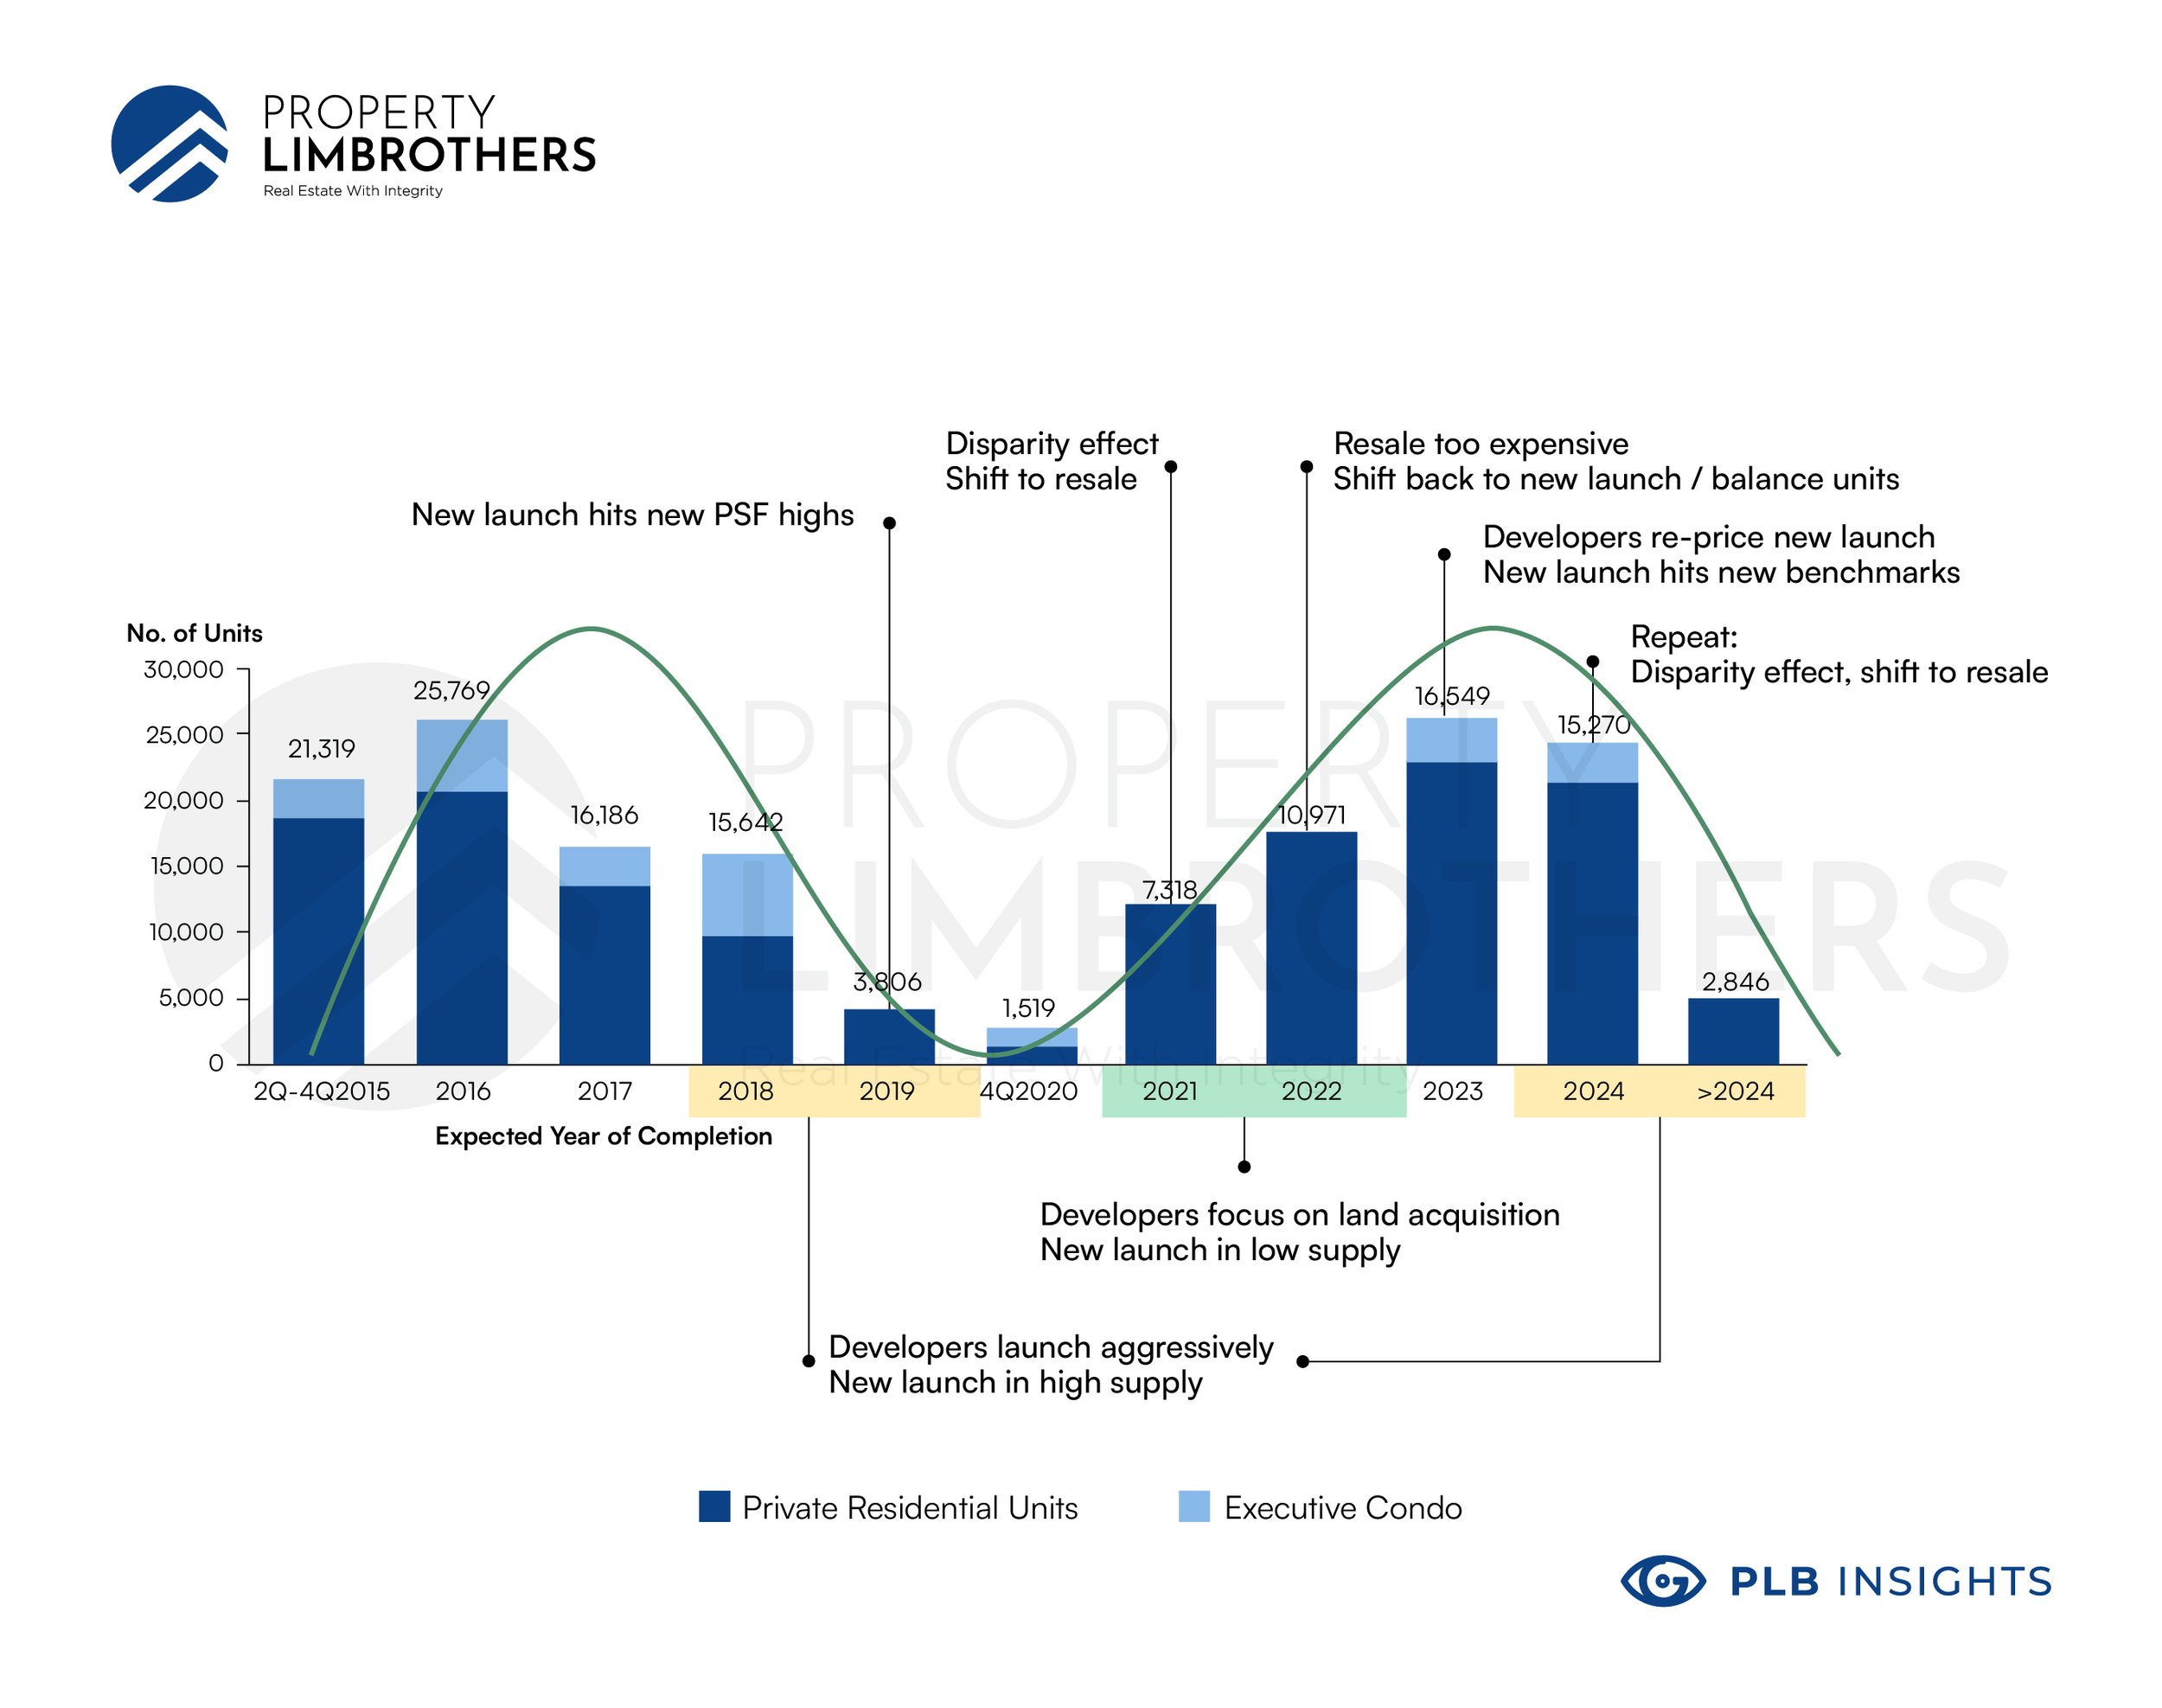
New launch supply chart
For example, in the period between 2018 to 2020, there was a low number of units entering into supply, indicating that developers were focused on new launches which will only be completed a couple of years later. These projects are reflected in the high number of units later on in 2022/ 2023 since there is a delay between the launch of a project and its final completion. One thing to note is that these supply charts are only snapshots of the supply situation. The data is provided by URA and has to be reviewed on a yearly basis as developers add or subtract from the supply based on their development decisions.
The current supply chart also supports our observation that 2019-2020 was the peak of the new launch market. Based on pricing data, 2-bedroom apartments were setting new benchmarks at record-high prices. Since then, it is almost impossible to find 2 bed-room apartments for under $1 million. Similarly, 1-bed room apartments have also seen great appreciation and units are selling for almost $900,000.
Combined with the COVID catalyst that pushed more buyers towards new, larger homes, the peak of the new launch market has also made many consider more affordable alternatives to new launches – namely in the resale market. Hence, we see a spillover of new launch buyers into resale units. Buyers now look towards resale units in the same location as these new launches and with similar features and size. This is expected to continue until resale prices are no longer attractive compared to new launch prices – and the cycle repeats.
Evidence for cycle – Price trends observed between 2020 – 2021
The cycle experienced from up until 2020 gives us a preview of the upcoming trends in the new launch and resale markets. Based on this, we know that developers will start to acquire more land in 2022 and 2023 and start constructing new launches beyond 2024.
The developer market also faces its own constraints of supply and demand. A shift towards land acquisition activity in 2022 will lead to high competition for the already limited supply of government land sales and en bloc options. We can expect land prices to be higher which translates to higher benchmarks for new launch prices passed on to buyers. Subsequently, buyers of these new launches who intend to sell upon TOP will be asking for even higher prices upon completion in 2024 and beyond.
Right now, the market for all segments appears to be wildly inflated. New launch prices are up due to developers pricing their units higher. TOP resale projects are also high due to sellers trying to make a profit from their purchase back in 2019/2020. Other resale projects are also up due to the demand spilling over from the previous two segments.
In this case, are there still any reasonable property decisions one can make?
Benefiting from this trend – the seller’s perspective
Given these trends that are pushing potential buyers towards more reasonably priced resales, the current market for resales has turned into a seller’s market with much more demand than supply. Such a seller’s market is favourable for owners looking to sell their recently purchased new launch, or even a resale with a large buyer audience.
In fact, we already see this reflected in the appreciating asking prices of resale properties.
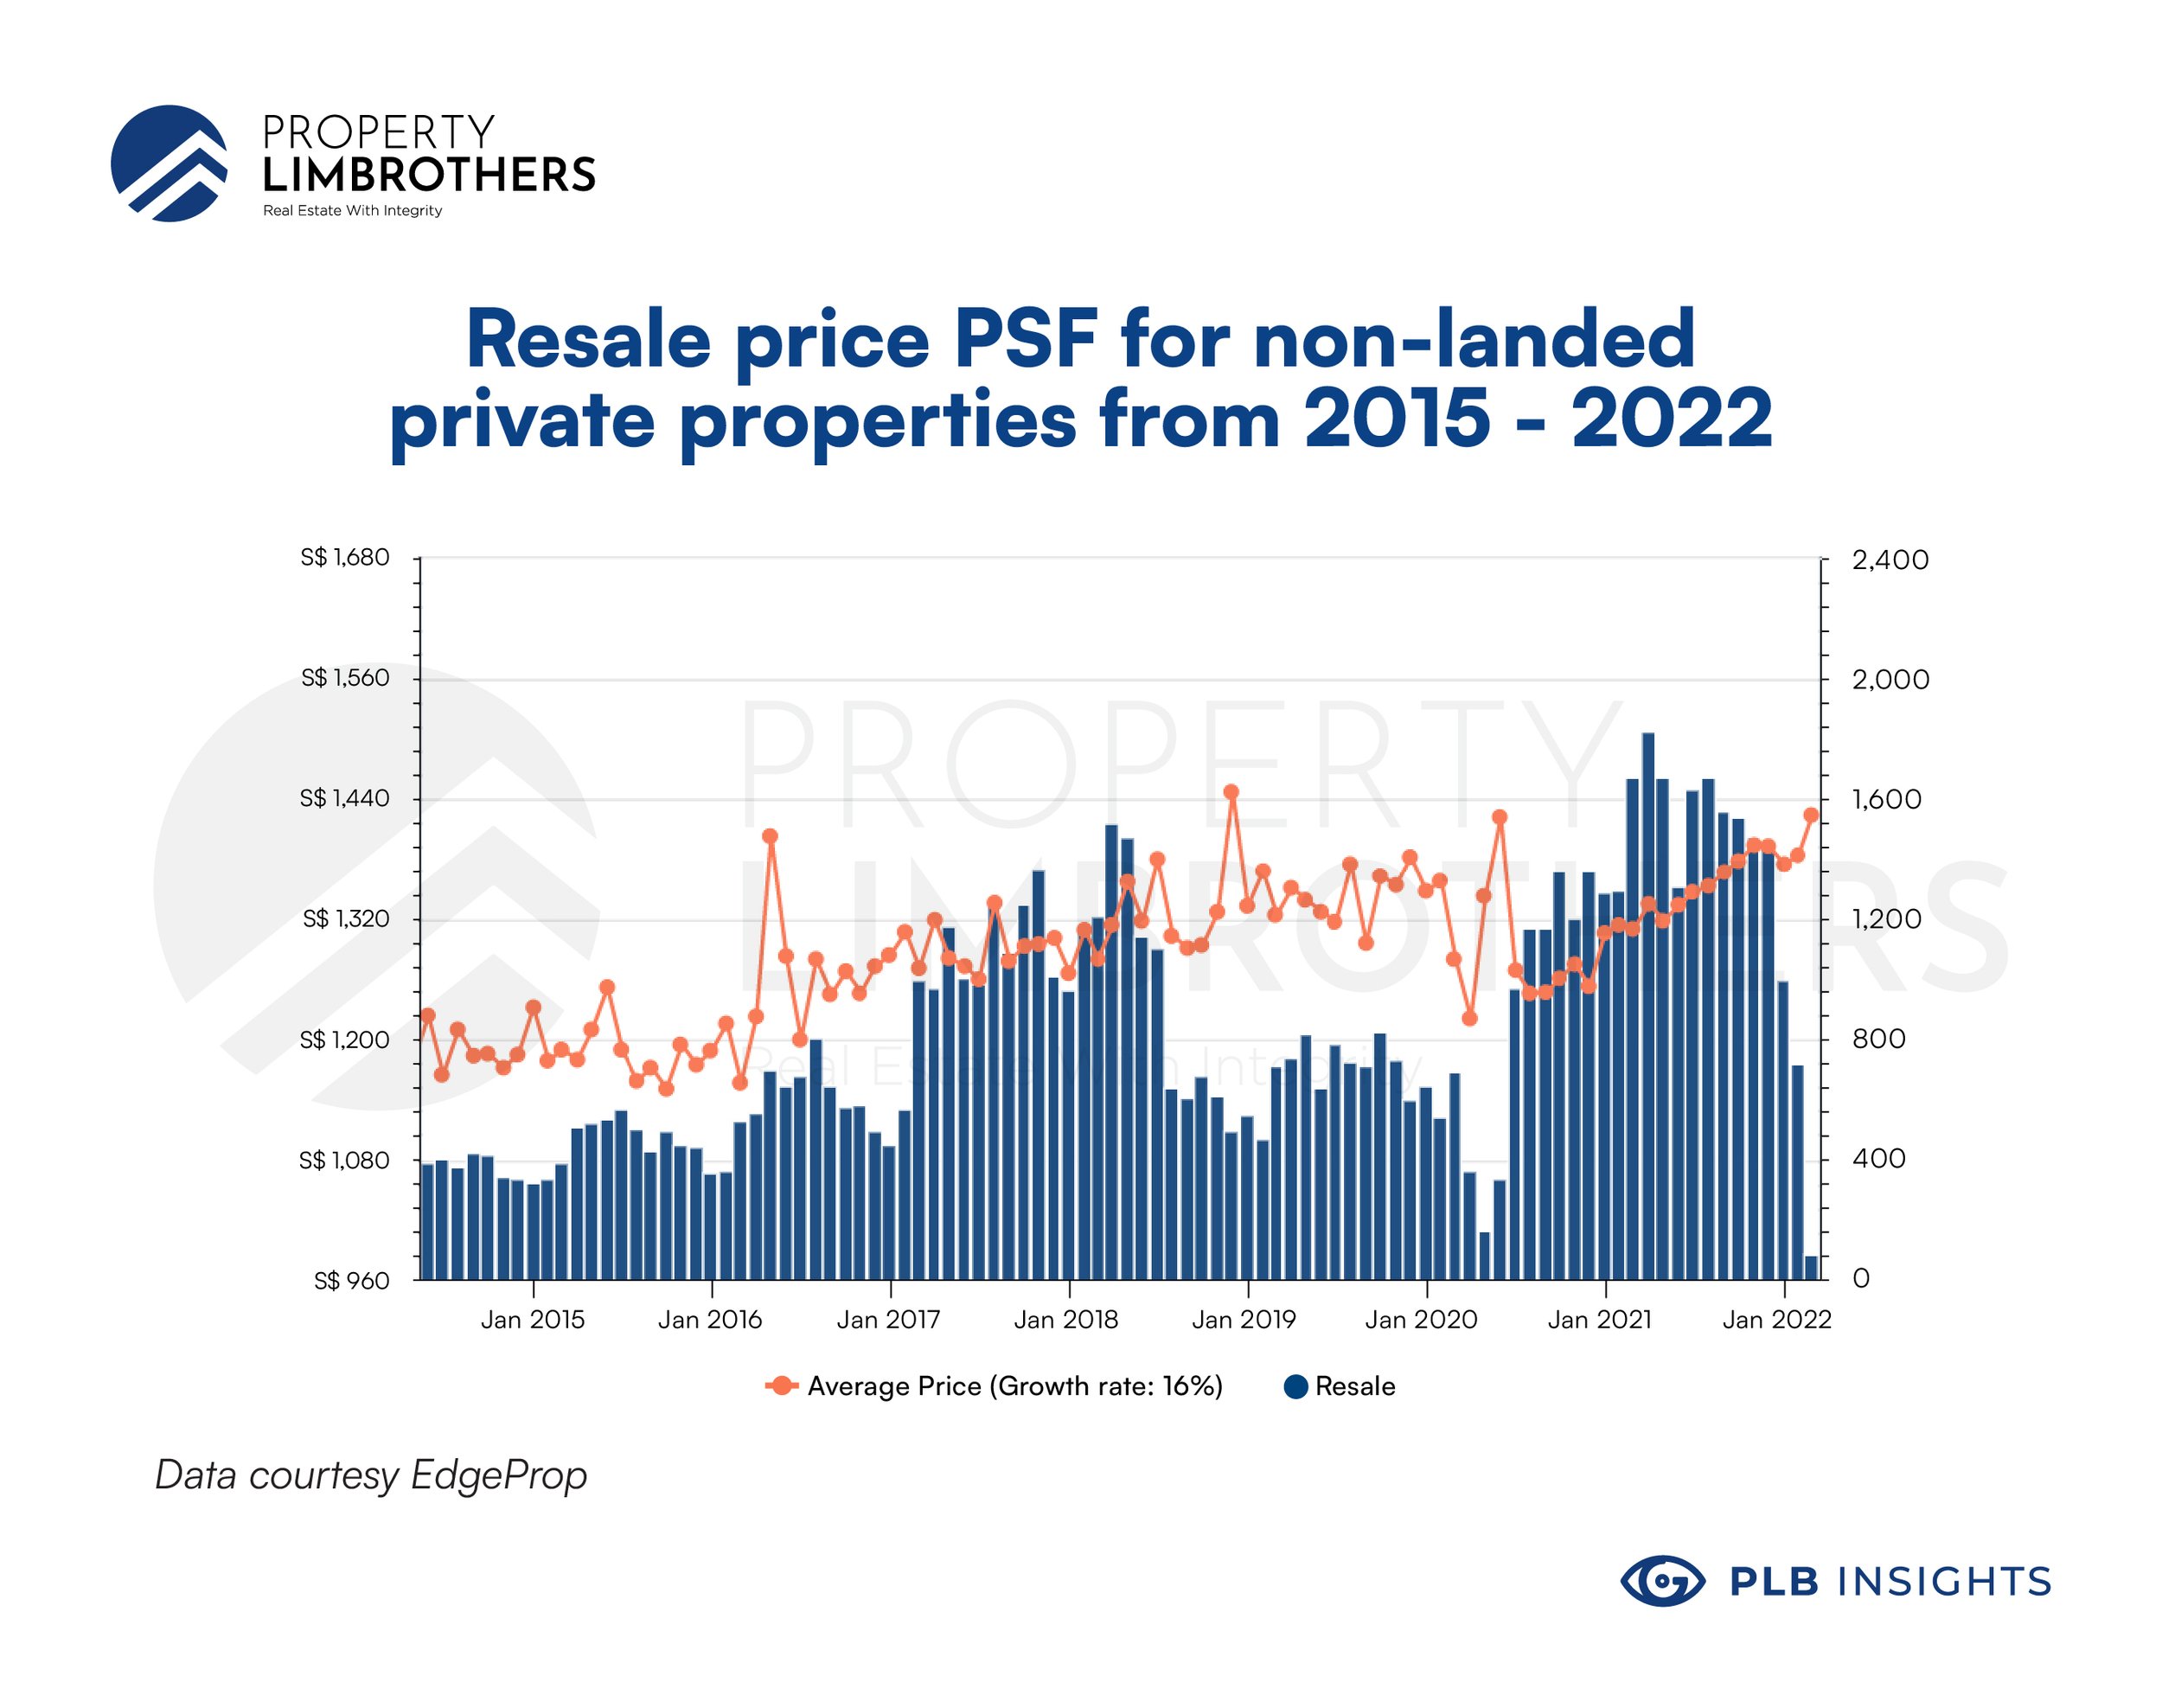
As high demand is anticipated, sellers will typically price their properties slightly higher than the previously transacted price for a unit in the same project or neighbourhood. Hence, asking prices continue to rise as buyers transact at increasingly higher prices.
Of course, this still assumes that the property being put up for sale is a moveable product – something that is highly desirable amongst the current buyer audience due to having features that fit the current trends in the market. Larger properties that have features such as outdoor spaces, more bedrooms, and more spacious interiors are a (literal) breath of fresh air for buyers who have lived with COVID restrictions for the past 2 years.
Benefiting from this trend – the buyer’s perspective
Despite the already high new launch prices and steadily inflating resale prices driven by spillover demand, there are still opportunities for savvy buyers to find undervalued properties – they may just be harder to find as compared to sellers.
The key to identifying such properties lies in differentiating between the two types of TOP (new launch) projects. Despite the name, there are new launch units that are not new at all.
TOP projects can be divided into ‘new’ new launches – units that were sold within 6-12 months of their initial launch – and ‘balance’ new launches – the rest of the units that remain unsold since the project launched.
A caveat of interpreting the new launch supply is that the completion chart only shows the completion times in the form of total supply of units entering the market. Specifically, it does not tell us how many units of the project were actually sold by developers and how many remain as ‘balance’ new launch units.
This provides an interesting observation: the price of ‘new’ new launches hitting the market in 2022/2023 will be priced relatively higher by developers based on a heated market. ‘Balance’ new launches which were unable to be sold back in 2019/2020 will still be priced at the initial PSF pricing that was set back when the market was less heated. Thus, ‘balance’ new launches offer a less expensive alternative while also being closer to TOP completion by 2024/2025 as compared to the ‘new’ new launches.
When the current prices of new launches are considered, buying a ‘balance’ new launch unit offers a good compromise of price PSF and smaller price quantums. Buyers get a practically new unit at only slightly more than the price of a resale. As more and more buyers realise that ‘balance’ new launch units are the best alternative to brand new launches and resales, prices for balance units will start to rise. This is what we think will happen moving forward from 2022 until new launch and resale prices start to cool off.
Finding suitable properties
Based on the trends that we have discussed so far, there are two segments of properties that look to be coming into the spotlight in 2022.
The first is resale properties with strong attributes which are reasonable buys all around despite the rising prices in the resale market. Here, we look at the more attractive 999-year leaseholds or freehold condos and apartments.
The second is ‘balance’ new launches which have lower PSF and suitable price quantums. The price quantum is important in determining the final affordability of the property as it impacts the mortgage repayments and other rate-based fees – legal, financial, and administrative.
Even though we expect these two segments to be great opportunities, this does not mean that all units of this type are suitable for good buys. Buyers should look out for units with good entry prices relative to other projects in the area, and good overall potential as an investment. There are many ways to quantify a property’s potential, but here at PropertyLimBrothers, we use our proprietary MOAT analysis – a holistic approach to comparing the relative strengths of a property.
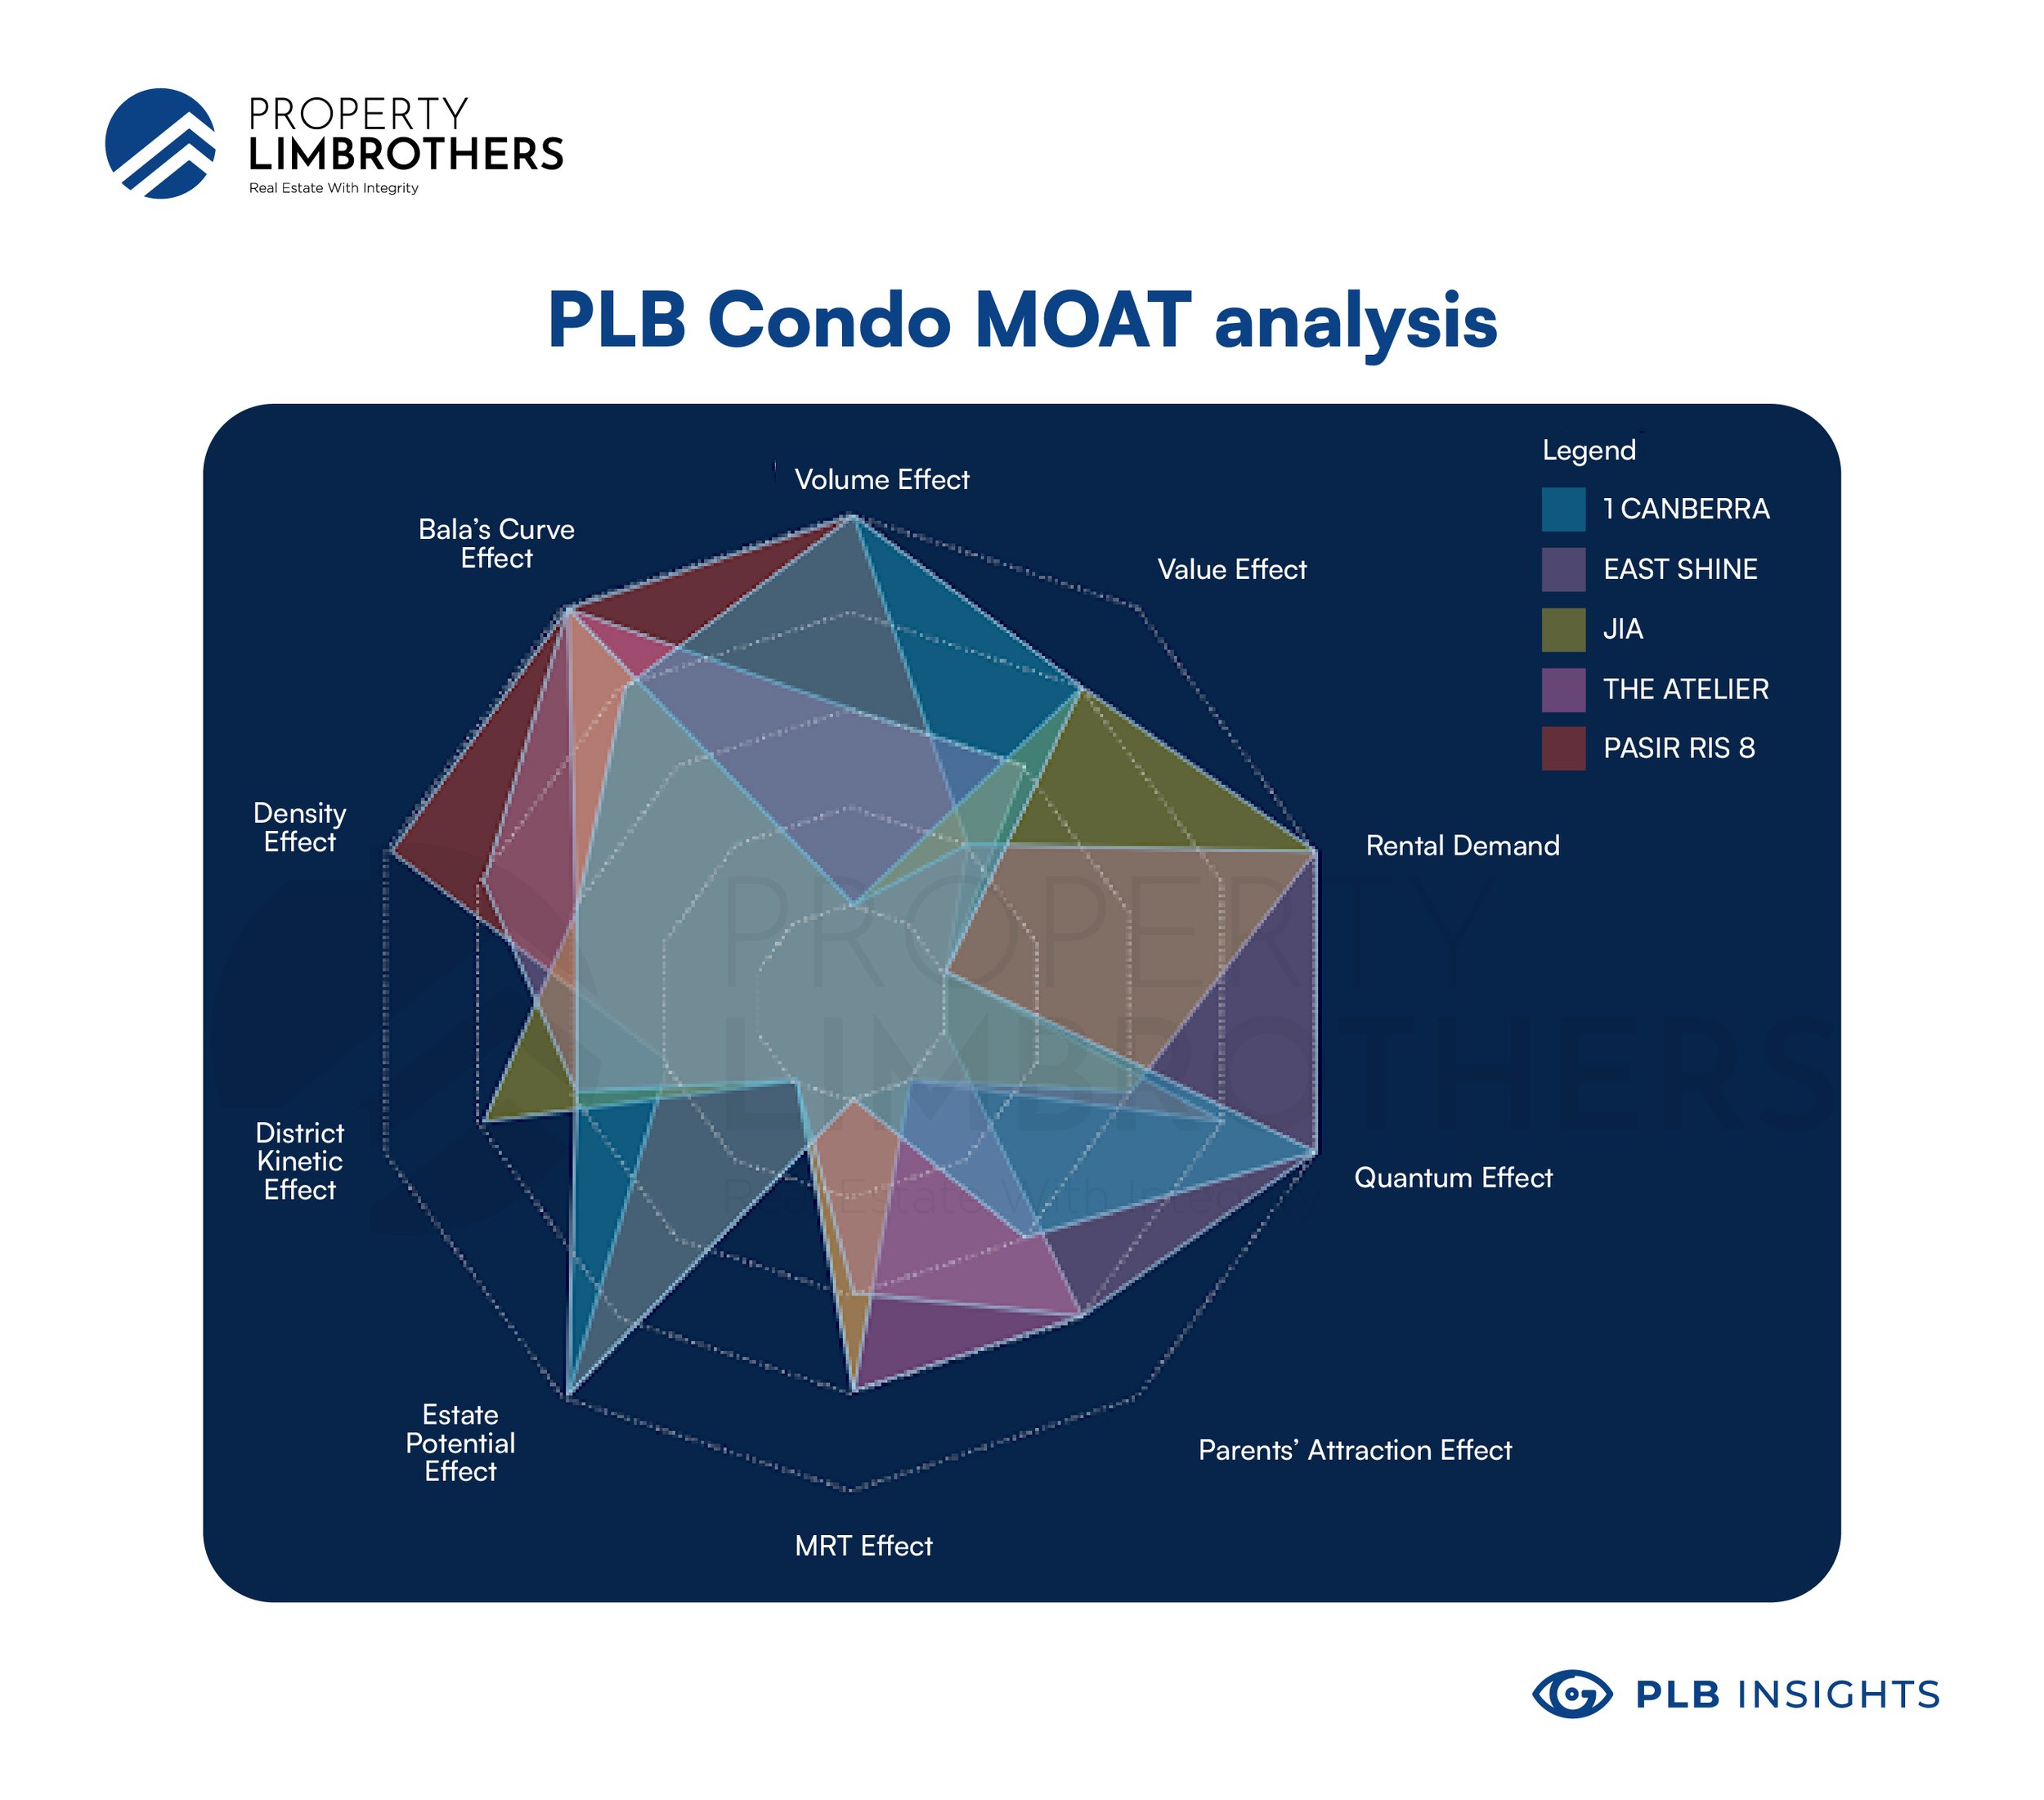
Sample of PLB MOAT Analysis
The MOAT approach considers a wide range of attributes that contribute most to the overall performance of the property. Property analysis is a whole topic on its own and we could spend writing an entire book about the do’s and don’ts of analysis.
However, we understand that some buyers often feel more comfortable doing their own homework. If you are one of them, do keep a lookout for our upcoming article on a step-by-step guide of how to do your own analysis before making a purchasing decision!
Conclusion
Amongst the many trends that we have observed in the real estate market, the shift away from ‘new’ new launch units is one that caught our attention. As both resale and new launch prices have skyrocketed amidst the 2020-2021 real estate market boom, there remain fewer opportunities for buyers to find deals on affordable non-landed properties.
The good news is that such properties exist, and can be found in the ‘balance’ units of new launches which are still selling for their original price back when the projects were launched. Of course, the market is also shifting its focus here, and prices are likely to rise for ‘balance’ units in 2022.
Not all ‘balance’ units are equally good properties, and proper research has to be done before buying them. With the plethora of resources available online, and the number of units available, it can be overwhelming for buyers to do their own due diligence on a property.
If the property analysis is something you need help with, please do not hesitate to contact us here. As usual, we would be more than happy to assist you. Till then, see you in our next article!


